
ArangoDB v3.12 is under development and not released yet.
This documentation is not final and potentially incomplete.
Dashboard
The Dashboard tab provides statistics which are polled regularly from the ArangoDB server.
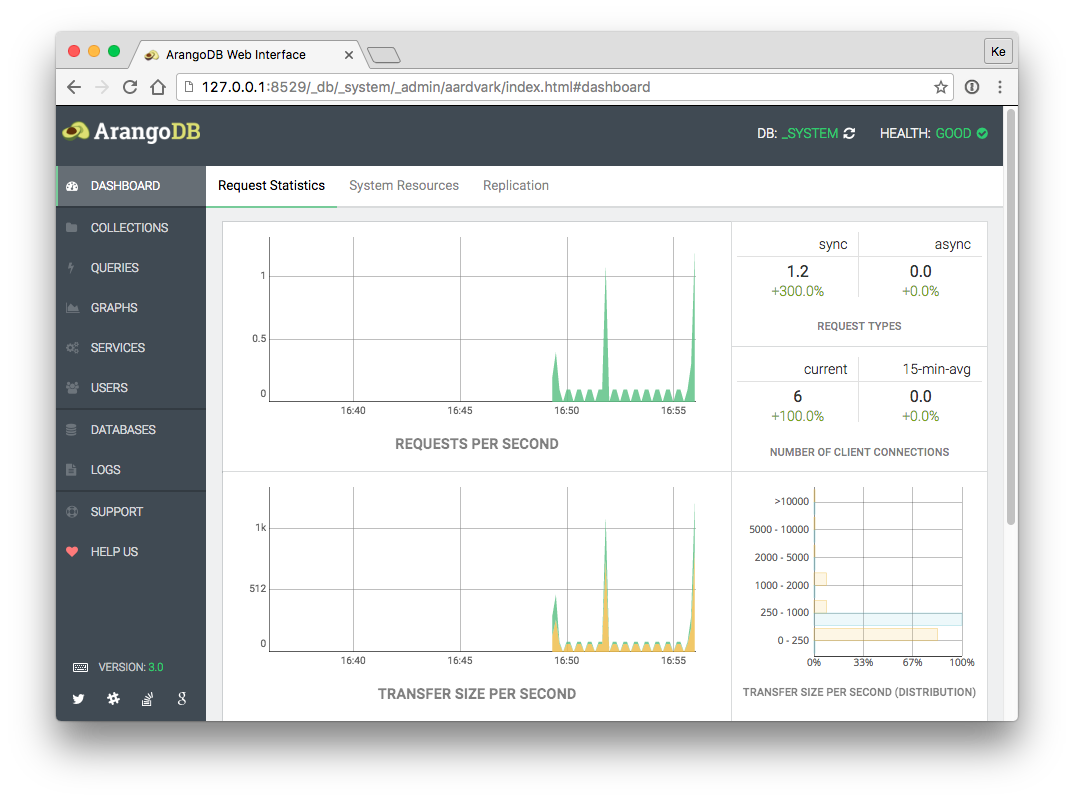
Requests Statistics:
- Requests per second
- Request types
- Number of client connections
- Transfer size
- Transfer size (distribution)
- Average request time
- Average request time (distribution)
System Resources:
- Number of threads
- Memory
- Virtual size
- Major page faults
- Used CPU time
Replication:
- Replication state
- Totals
- Ticks
- Progress